MACD for Beginners: How to Read Crypto Trading Signals
MACD (Moving Average Convergence Divergence) is a technical indicator that shows the relationship between two moving averages of an asset's price. MACD helps traders identify new trends, momentum, and potential reversals.
If RSI is the "thermometer," then MACD is the "compass" that shows trend direction.
What Is MACD?
MACD consists of 3 components:
- MACD Line: 12-day EMA - 26-day EMA (blue line)
- Signal Line: 9-day EMA of MACD Line (orange line)
- Histogram: Difference between MACD Line and Signal Line
In simple terms: MACD Line = short-term trend. Signal Line = long-term trend. When they cross, that's an important signal!
3 Main MACD Signals
1. MACD Crossover — Buy/Sell Signal
When MACD Line crosses Signal Line from below → bullish (buy) signal.
When MACD Line crosses Signal Line from above → bearish (sell) signal.
Example: MACD Line (blue) crosses Signal Line (orange) from below. This indicates momentum is rising → potential price increase.
2. Histogram — Momentum
The histogram shows how strong the current momentum is:
- Positive histogram (green): Upward momentum
- Negative histogram (red): Downward momentum
- Shrinking histogram: Momentum is weakening
When the histogram changes from negative to positive, it could be the start of a new trend.
3. Zero Line Cross — Trend Change
When MACD Line crosses the zero line from below → trend changes upward.
When MACD Line crosses the zero line from above → trend changes downward.
Example: MACD in Action
📋 Simple MACD Strategy
- Buy when MACD Line crosses above Signal Line
- Sell when MACD Line crosses below Signal Line
- Hold when histogram is positive and increasing
- Be cautious when histogram starts shrinking
MACD vs RSI — When to Use Which?
| Aspect | MACD | RSI |
|---|---|---|
| Type | Trend-following | Momentum |
| Best for | Identifying new trends | Identifying overbought/oversold |
| Signals | Crossover + Zero line | Overbought/Oversold + Divergence |
| Weakness | Slow (lagging) | Many false signals in trending markets |
Tip: Use MACD for trend confirmation, and RSI for entry timing. Combining both is very powerful!
When Is MACD Most Effective?
- Trending market: MACD is very effective when the market has a clear trend
- Sideways market: MACD produces many false signals — avoid using it alone
- Higher timeframes: MACD on Daily or 4H is more reliable than on 1H or 15M
Common MACD Mistakes
- Trading every crossover: Not all crossovers are valid — check the histogram and volume
- Ignoring the zero line: Crosses near the zero line are stronger signals
- Using MACD alone: Always confirm with RSI or other indicators
- Expecting instant results: MACD is a lagging indicator — trends may already be underway
Conclusion
MACD is a versatile indicator that helps you identify trends and momentum in crypto trading. By understanding crossovers, histogram, and zero line crosses, you can make better trading decisions.
Tip: Use MACD with an automated trading bot like Bearproof for automatic execution when signals appear.
What are the best MACD settings for crypto?
The default settings (12, 26, 9) work well for most crypto trading. For shorter timeframes, some traders use (8, 17, 9) for faster signals.
Is MACD better than RSI?
Neither is "better" — they serve different purposes. MACD is for trend identification, RSI is for momentum. Using both together gives the best results.
Example Chart — MACD in Action
BTC/USDT chart with MACD indicator. Notice where MACD Line (blue) crosses Signal Line (orange) — those are the potential entry/exit points.
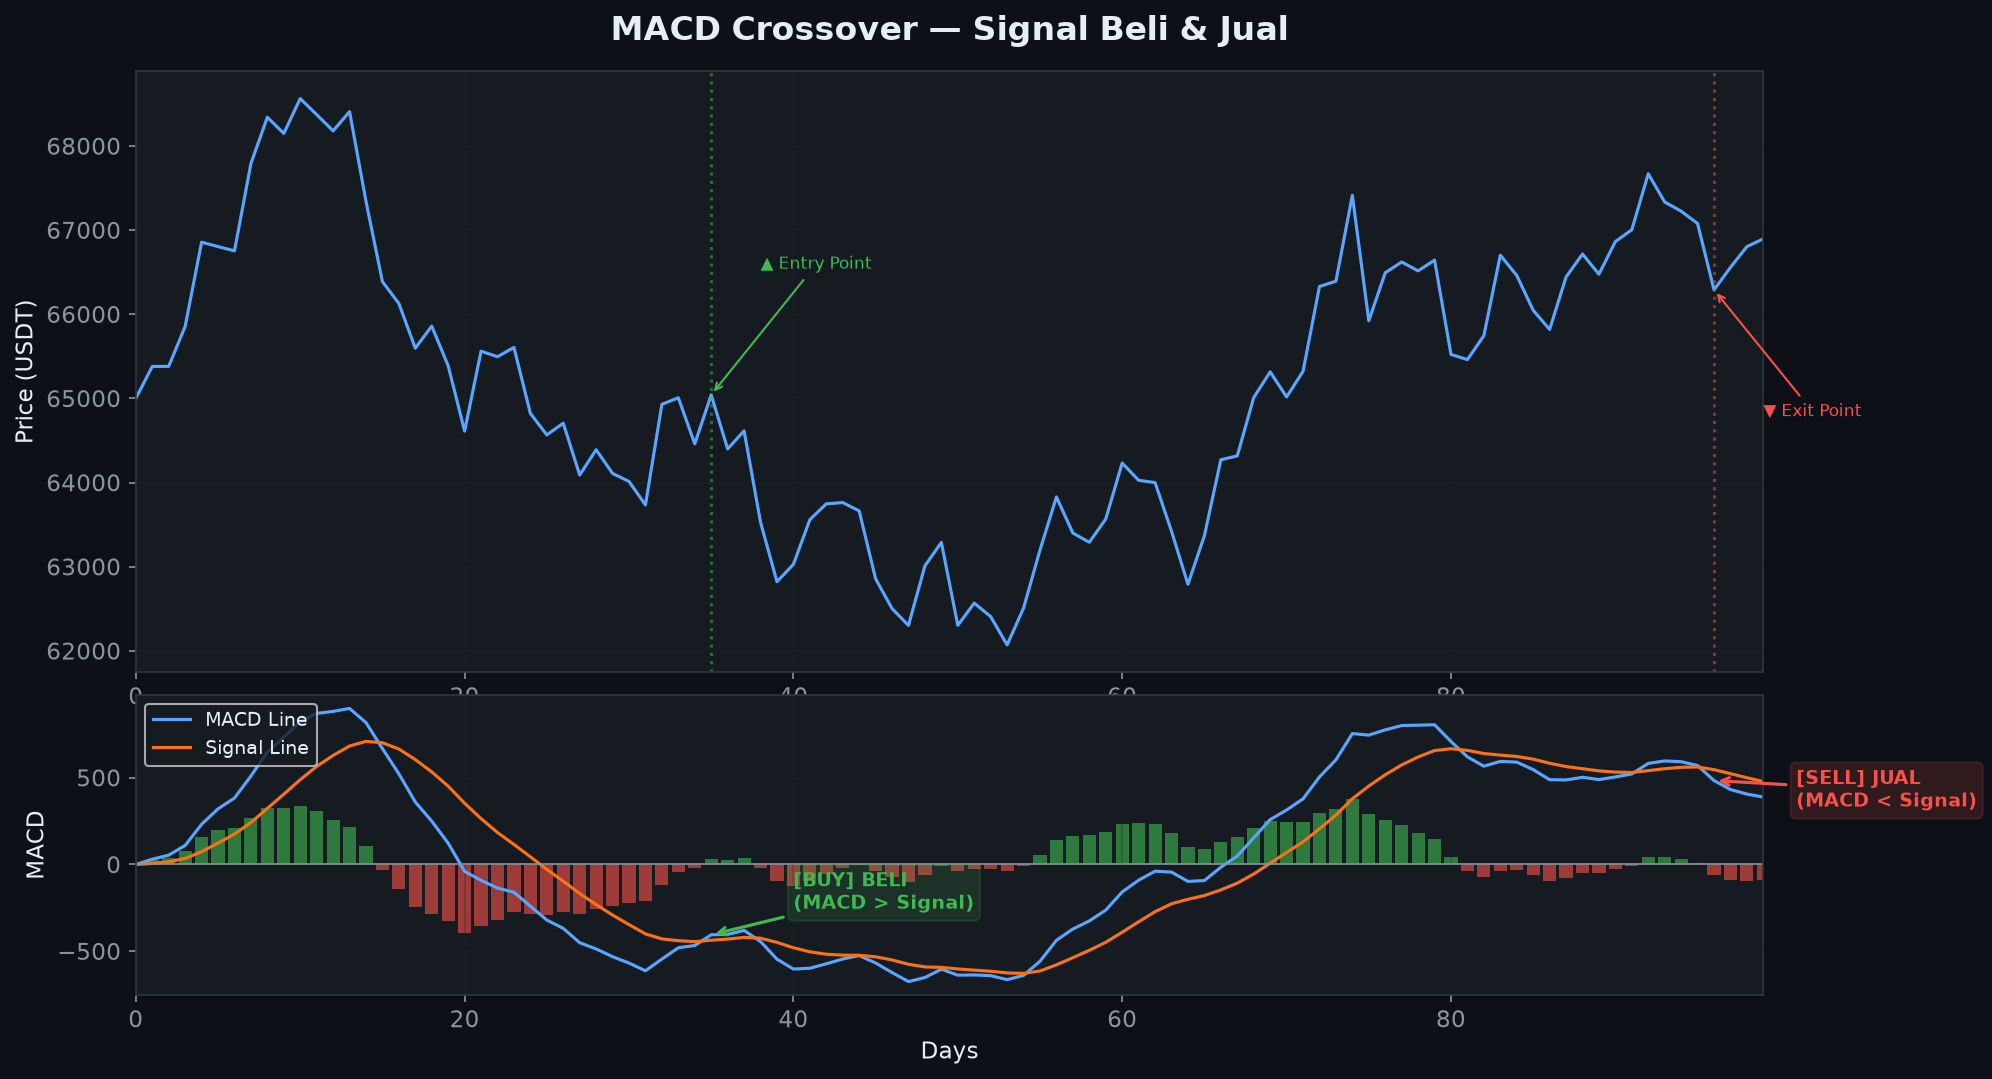
Notice: green = entry point (buy), red = exit point (sell) when MACD Line crosses Signal Line.
Example Chart — MACD Histogram Momentum
The histogram shows how strong the current momentum is. Growing histogram = strong momentum, shrinking = weakening momentum.
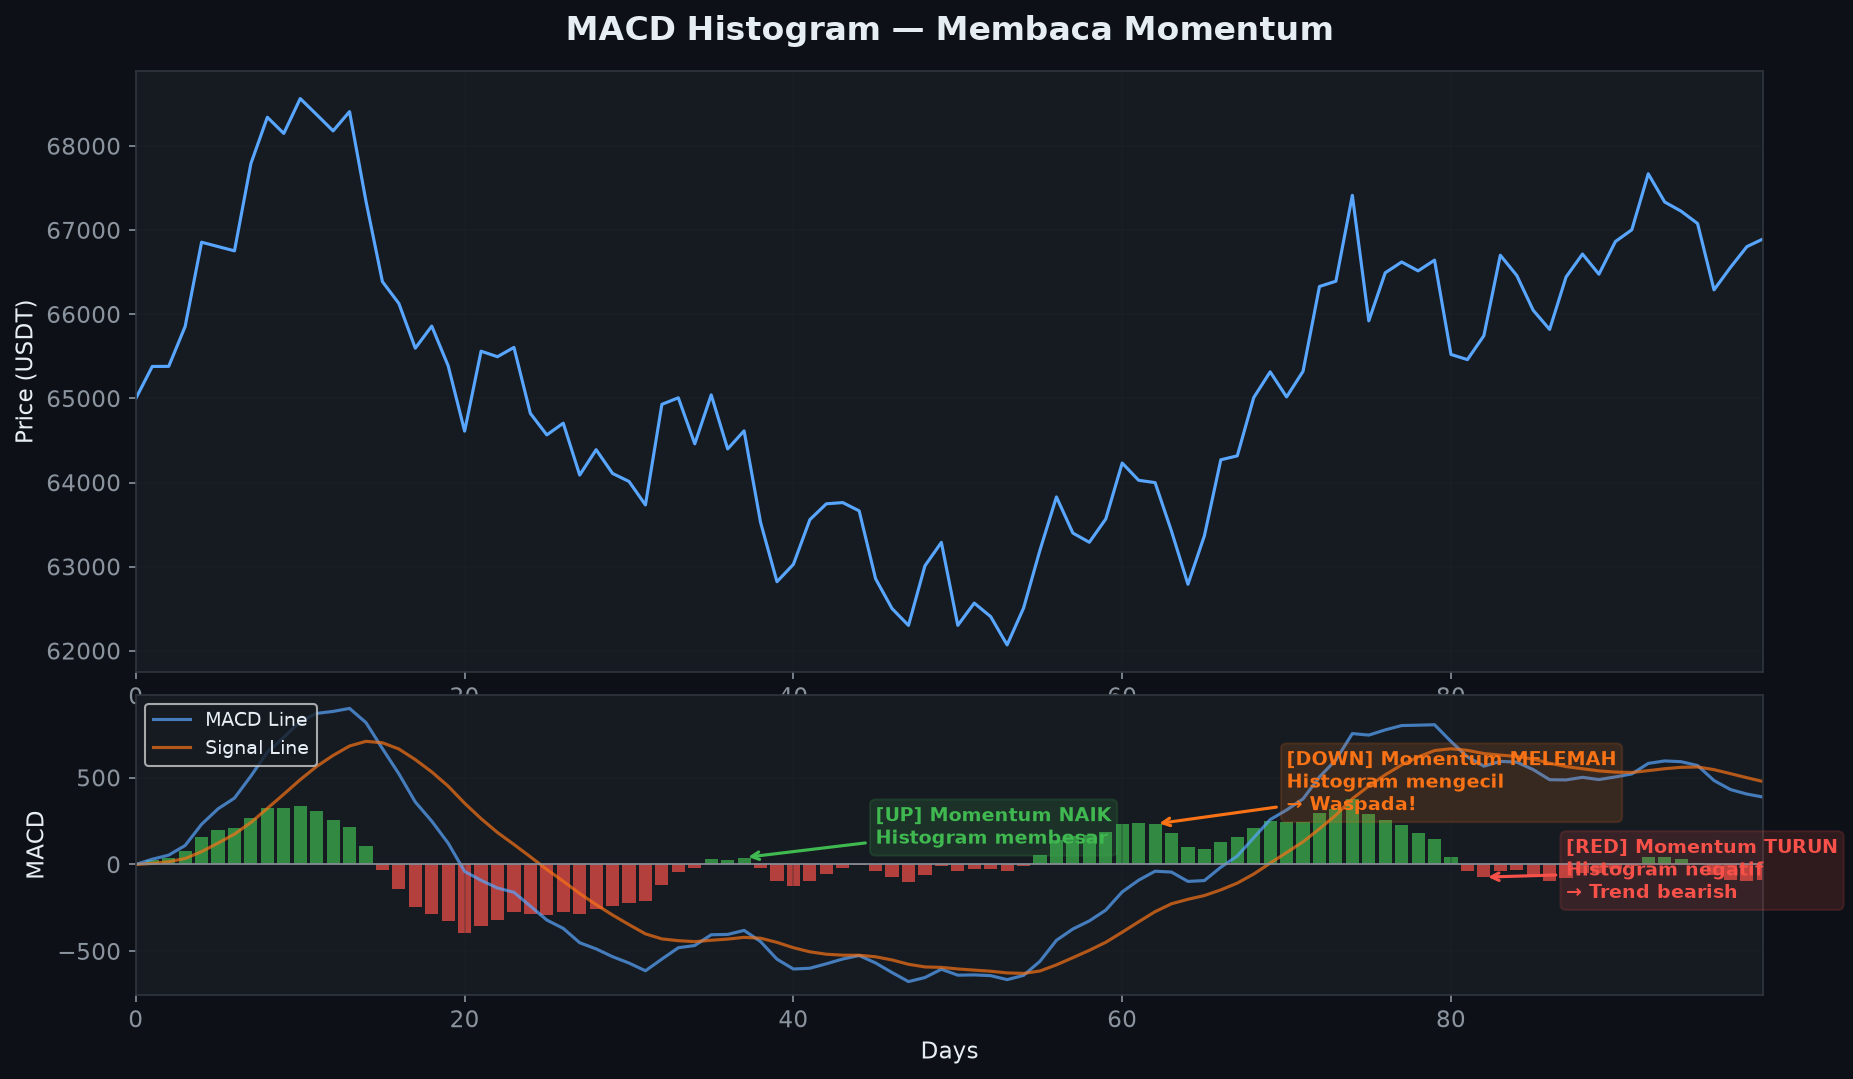
Notice: green growing = upward momentum, shrinking = starting to weaken, red = trend turning bearish.