WHAT IS RSI? HOW TO READ THIS CRYPTO TRADING INDICATOR
RSI (Relative Strength Index) is a technical indicator that measures the speed and change of price movements. RSI helps traders identify when an asset may be overbought (too expensive) or oversold (too cheap).
In this article, you'll learn how to read RSI and use it to make better trading decisions.
RSI Is Like a "Thermometer" for Price
Think of RSI as a thermometer for crypto prices. Just like a thermometer shows whether your body temperature is normal, too high, or too low, RSI shows whether price is normal, too high, or too low.
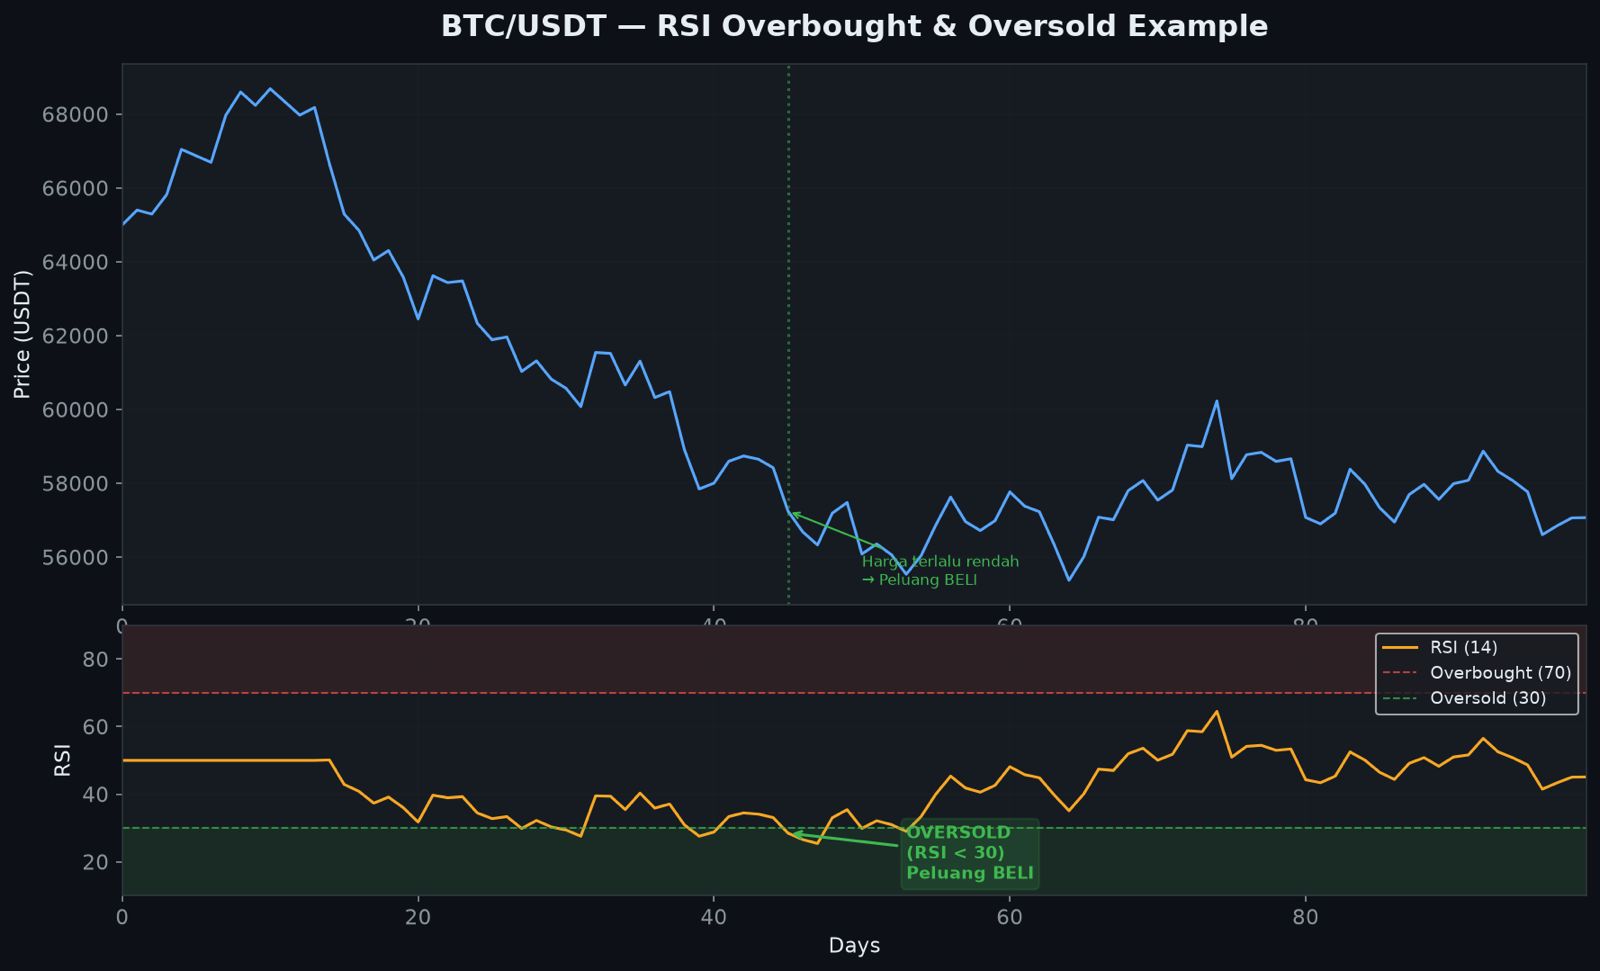
- RSI above 70: Overbought — price may be too high and could drop
- RSI below 30: Oversold — price may be too low and could rise
- RSI between 30-70: Normal — no strong signal
How Does RSI Work?
RSI is calculated using a mathematical formula that compares average gains to average losses over a period of time (usually 14 days).
Don't worry about the formula — what matters is knowing how to read it:
- RSI rising: Gains are larger than losses → upward momentum
- RSI falling: Losses are larger than gains → downward momentum
3 RSI Strategies for Beginners
1. Buy When Oversold, Sell When Overbought
This is the simplest RSI strategy:
- Buy when RSI drops below 30 (oversold)
- Sell when RSI rises above 70 (overbought)
Example: Bitcoin drops sharply and RSI hits 25. This could be a good time to buy. When RSI reaches 75, consider selling.
2. Look for Divergence
Divergence occurs when price moves in the opposite direction of RSI:
- Bullish Divergence: Price falls, but RSI rises → potential price increase
- Bearish Divergence: Price rises, but RSI falls → potential price decrease
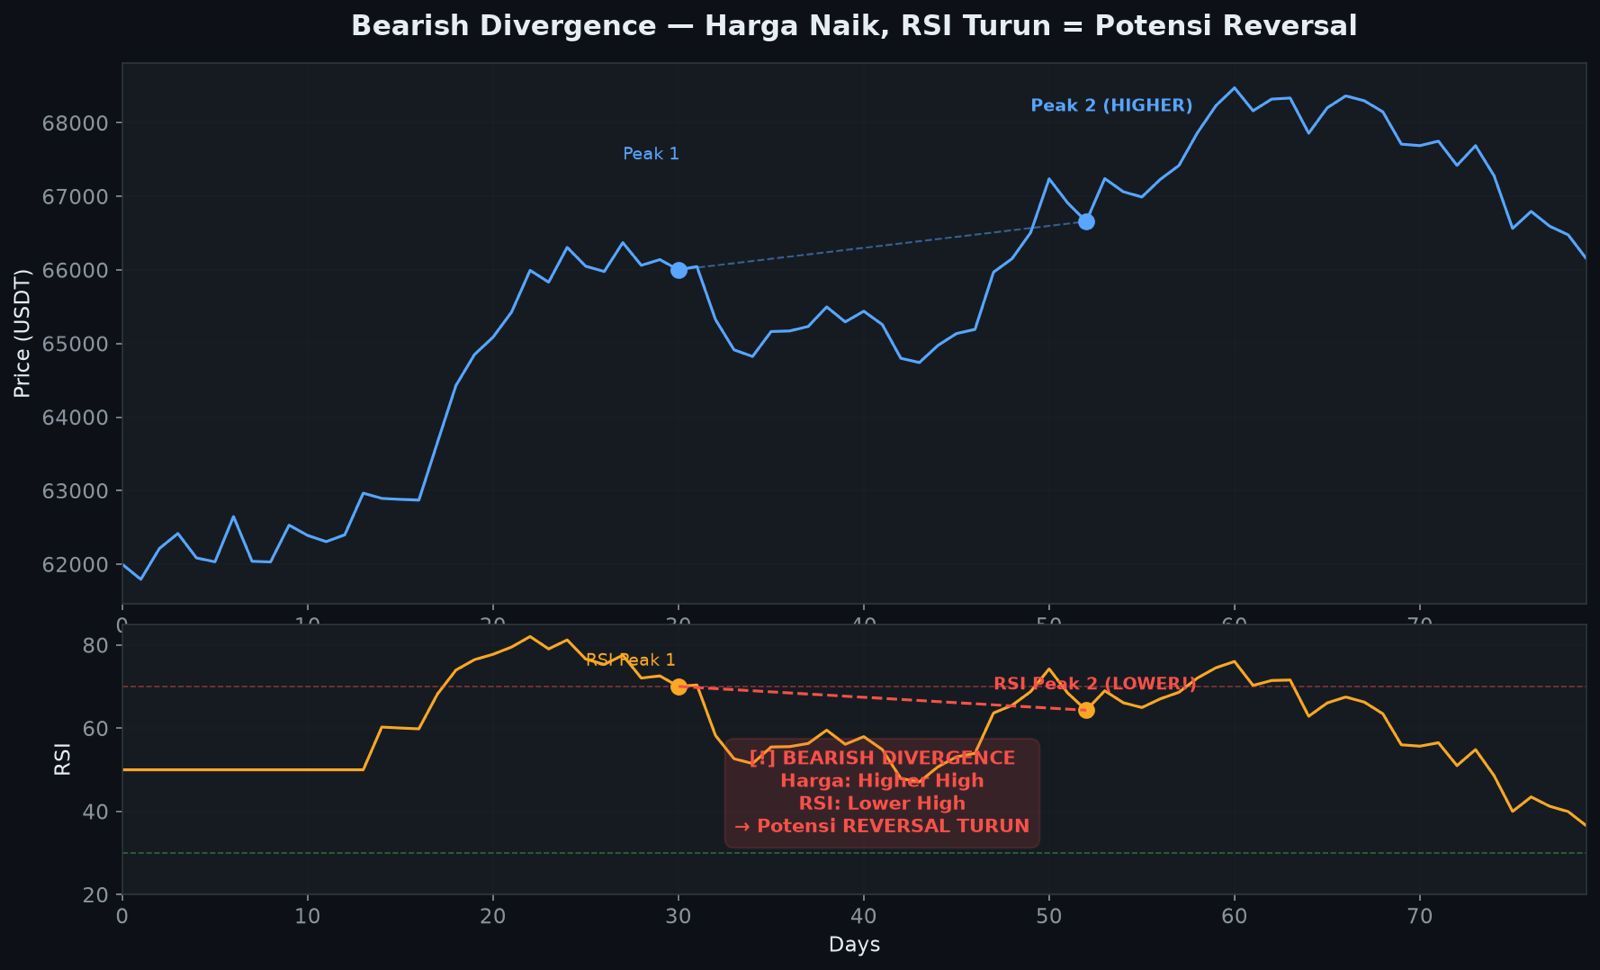
Divergence is a very strong signal because it shows momentum changing before it shows up in price.
3. Use RSI with the Trend
In an uptrend, RSI typically moves between 40-80. In a downtrend, RSI typically moves between 20-60.
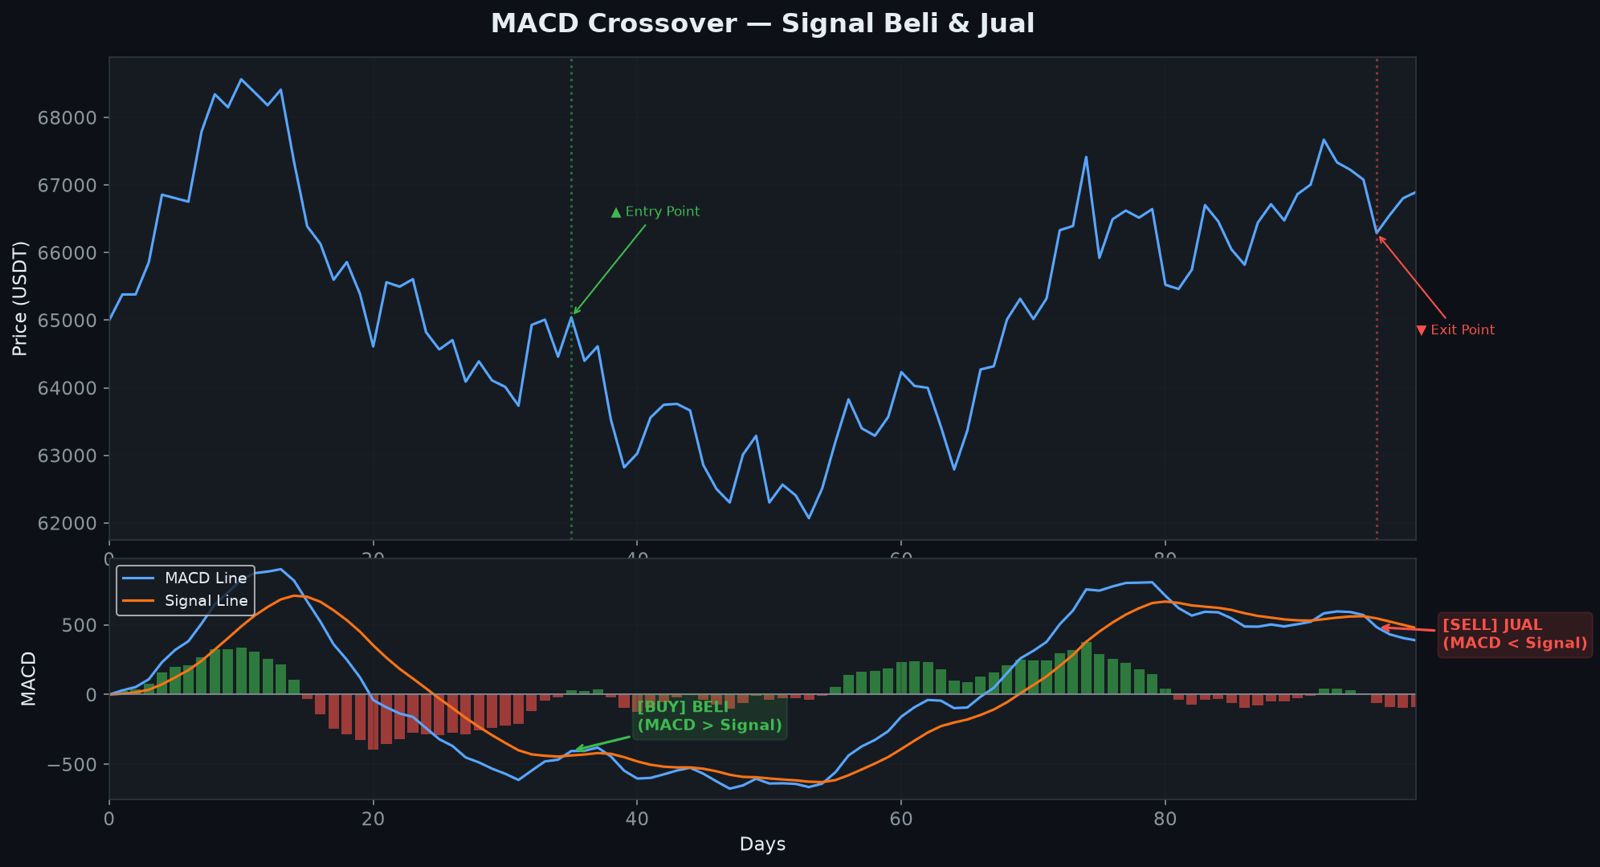
Tip: Don't use RSI alone. Combine it with other indicators like MACD or Support/Resistance for stronger confirmation.
Common RSI Mistakes
- Overtrading: Just because RSI is oversold doesn't mean you should buy immediately. Wait for confirmation!
- Ignoring the Trend: RSI doesn't work well in strongly trending markets
- Wrong Settings: RSI 14 is good for swing trading, but may need adjustment for day trading
- No Risk Management: Always use stop loss, no matter how good the RSI signal
When Is RSI Most Effective?
- Ranging (sideways) markets: RSI is very effective when price is moving within a range
- Support/Resistance: RSI at 30/70 levels near support/resistance gives stronger signals
- Higher timeframes: RSI on Daily or 4H is more reliable than 1H or 15M
Conclusion
RSI is a simple but powerful indicator for crypto trading. By understanding overbought/oversold levels and divergence, you can make better trading decisions.
Tip: Use RSI with an automated trading bot like Bearproof for automatic execution when signals appear.
Is RSI 14 or RSI 7 better for crypto?
RSI 14 is the standard and works well for most situations. RSI 7 is more sensitive and good for scalping, but produces more false signals. For beginners, start with RSI 14.
Can I use RSI for day trading?
Absolutely! But adjust the RSI period. For day trading, use RSI 7-9 on 1H or 15M timeframes. For swing trading, stick with RSI 14 on 4H or Daily.